Web application for mobility data analysis and quality assurance
Data-driven traffic management
Understand. Plan. Communicate.
Understand. Plan. Communicate.
The Dynamic Traffic Monitor (DTM) supports data-driven analysis and evaluation of urban mobility – from traffic planning and management to the assessment of mobility strategies.


Easy to Use
Evidence-Based Decisions
High-Performance Analyses
Holistic View
Reliable Data Foundation
Comprehensive Consultation
Time-Saving Processes
Easy to Use
Evidence-Based Decisions
High-Performance Analyses
Holistic View
Reliable Data Foundation
Comprehensive Consultation
Time-Saving Processes
Application
More Clarity. More Impact.
Insights for traffic planning and mobility management.
With DTM, complex traffic data is transformed into clear, actionable insights you can use immediately – for efficient measures, transparent decisions, and sustainable mobility for all.
Data-driven decisions
Identifying critical hotspots enables the development of new strategies, the evaluation of measures, and their targeted refinement.
Monitoring developments
Analysis of measures and indicators from mobility strategies and Sustainable Urban Mobility Plans (SUMPs), along with relevant mobility data, provides a reliable foundation for assessing developments and ensuring transparent communication of the impact of measures.
Inquiries from politics & press
Fast responses based on real-world data enable well-founded, data-driven arguments towards policymakers, the public, and the media.
Data quality assurance
Automated checks for completeness and transmission pathways, as well as the visualization of anomalies, ensure transparency and quality assurance.
Improve collaboration
Cross-departmental use and visibility of strategies from neighboring municipalities promote transparency, coordination, and aligned planning.
Get started now
Book an appointment or get in touch – we’ll be happy to assist you.
Modules
From Data to Decisions
From Data to Decisions
Shaping the Mobility Transition.
Shaping the Mobility Transition.
All modules at a glance: Combine the right building blocks for your use cases to detect congestion, evaluate measures, and actively shape mobility developments.
All modules at a glance: Combine the right building blocks for your use cases to detect congestion, evaluate measures, and actively shape mobility developments.


Expertise
Shaping the Future
Built on Experience. Guided by Innovation.
For many years, we have been developing data-driven software solutions for traffic management and planning: practical, scalable, and focused on impact.
In close collaboration with public authorities, we combine technological innovation with a deep understanding of planning and operational needs, creating a solid foundation for informed decisions and sustainable, integrated mobility.
Features
Advanced Mobility Data Analysis
How the Mobility Transition Works
The DTM supports modern, data-driven traffic management: from hotspot analysis and monitoring to evaluating measures. Flexible organizational structures enable cross-departmental collaboration.
The DTM supports modern, data-driven traffic management: from hotspot analysis and monitoring to evaluating measures. Flexible organizational structures enable cross-departmental collaboration.
01
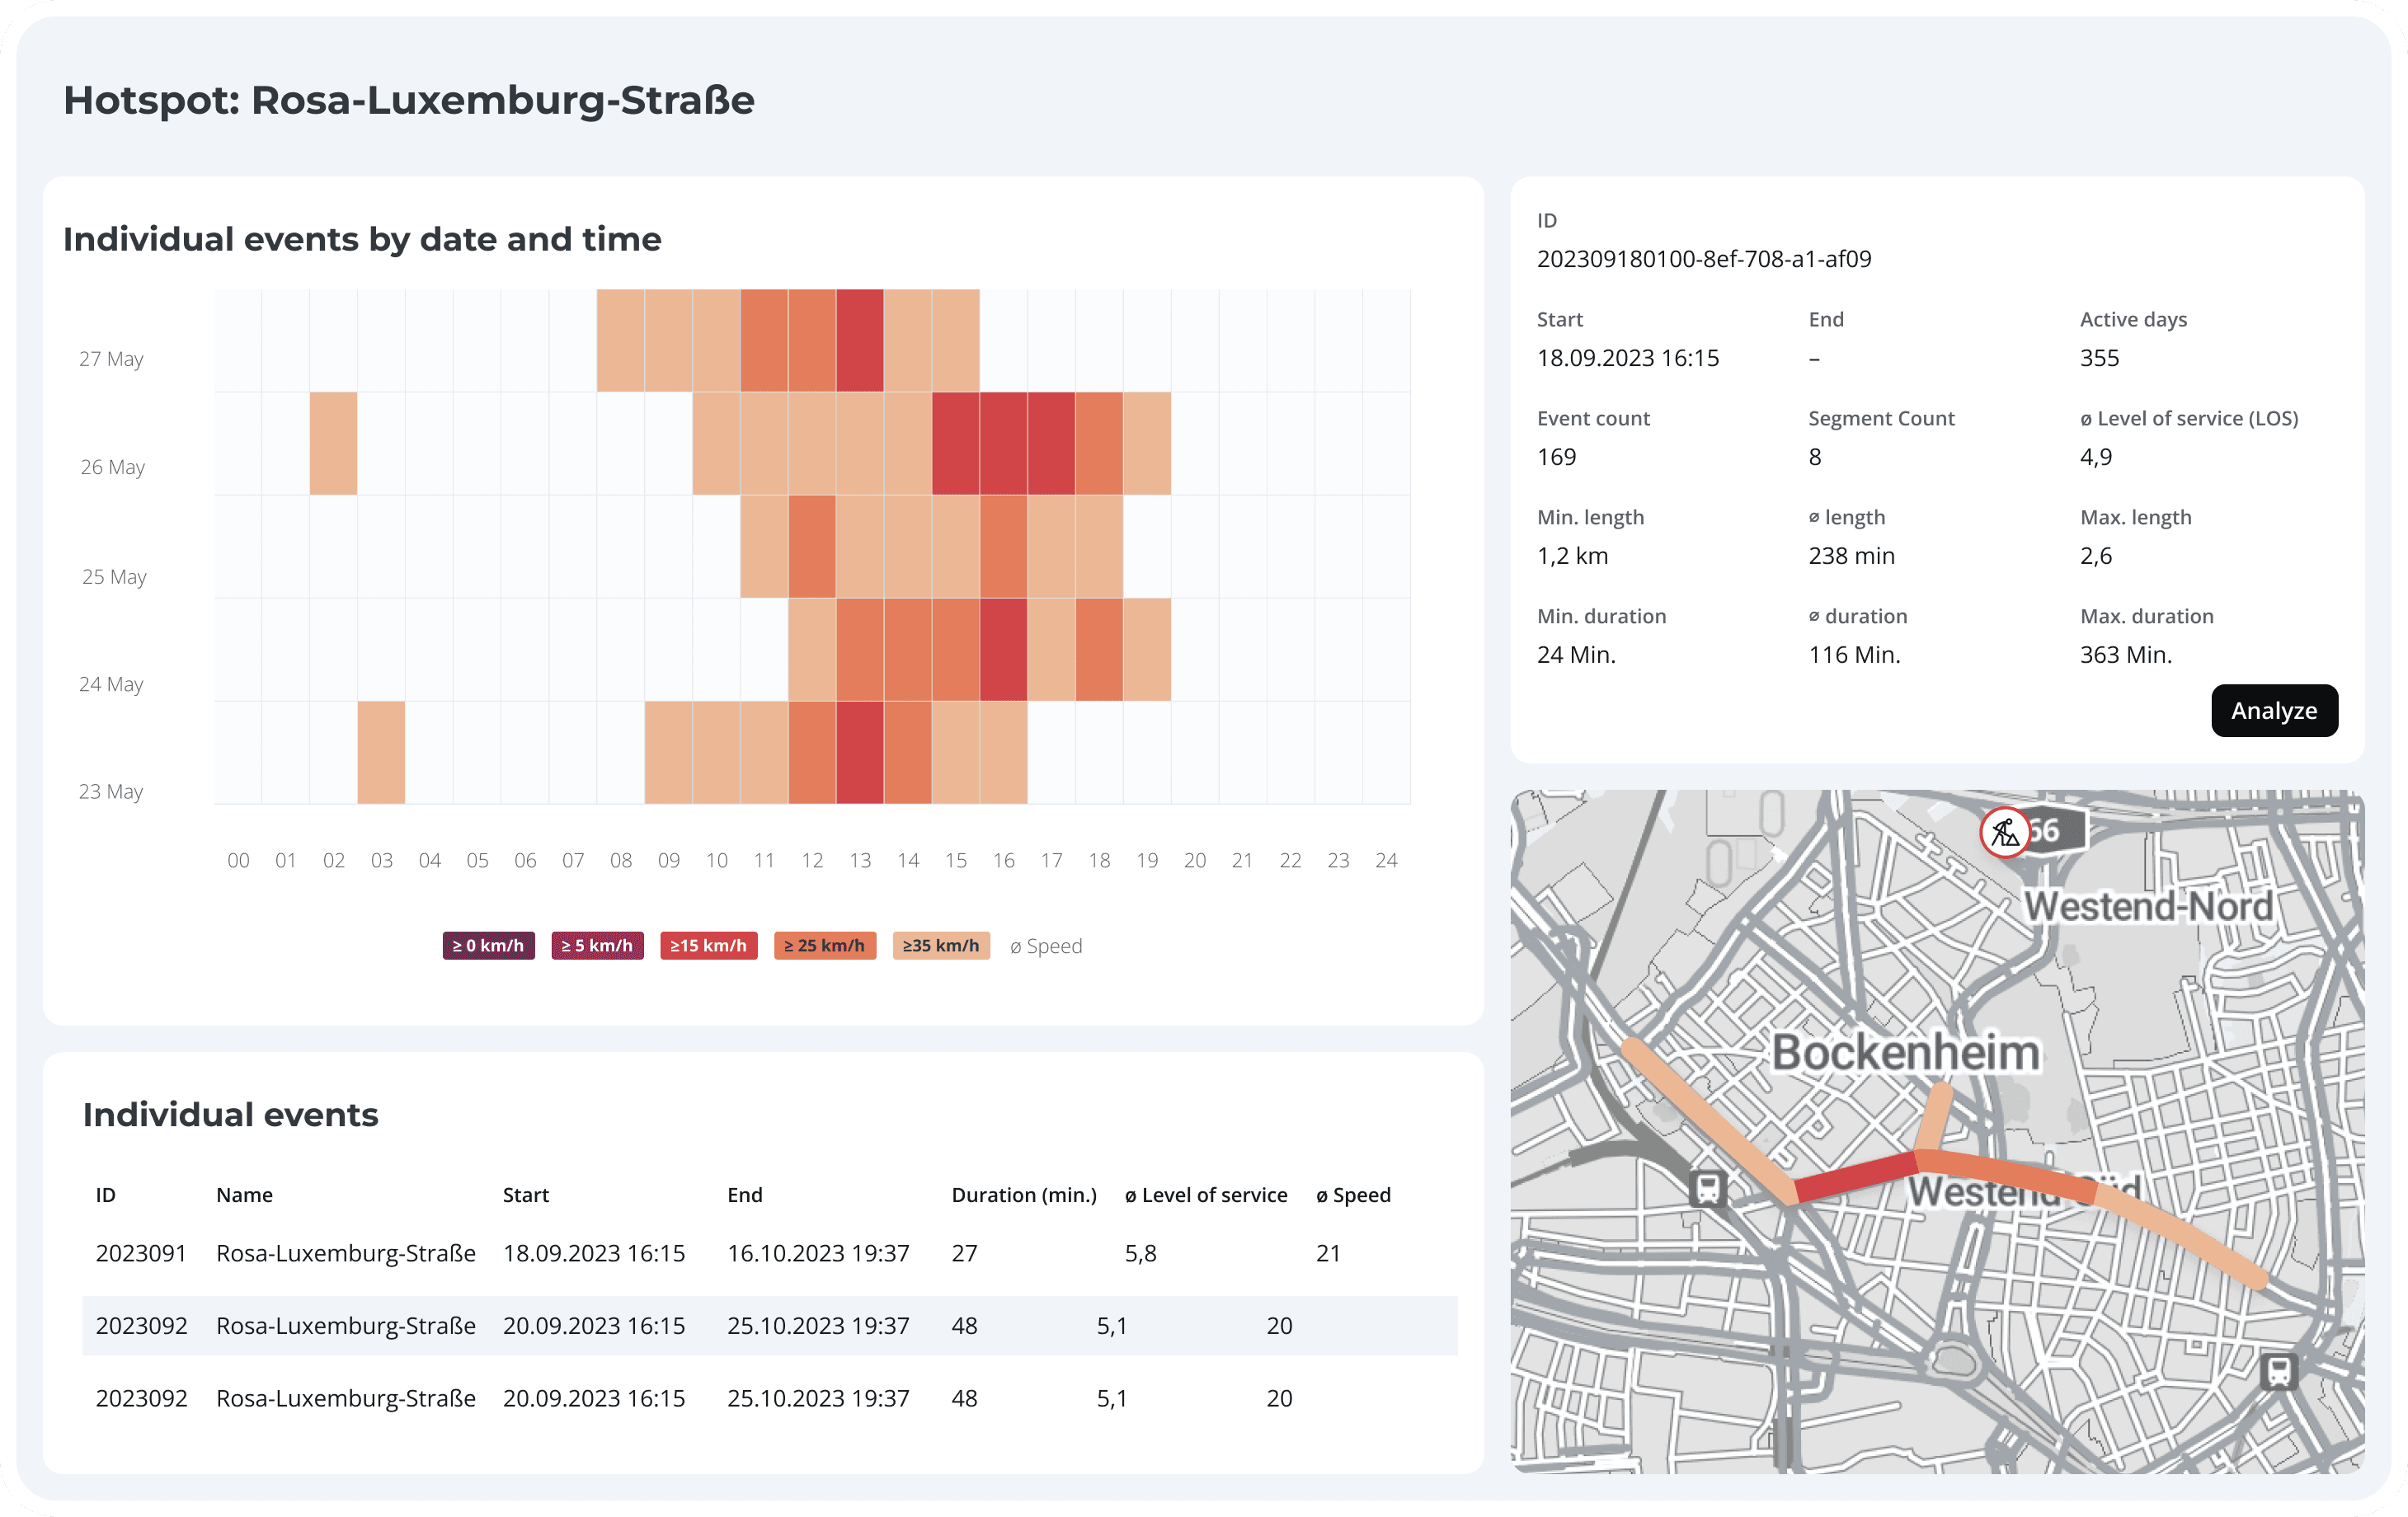
Hotspots
Identifying Problems
Identifying traffic-related and environmental hotspots and their causes is the basis for planning measures.

01
Hotspots
Identifying Problems
Identifying traffic-related and environmental hotspots and their causes is the basis for planning measures.

02
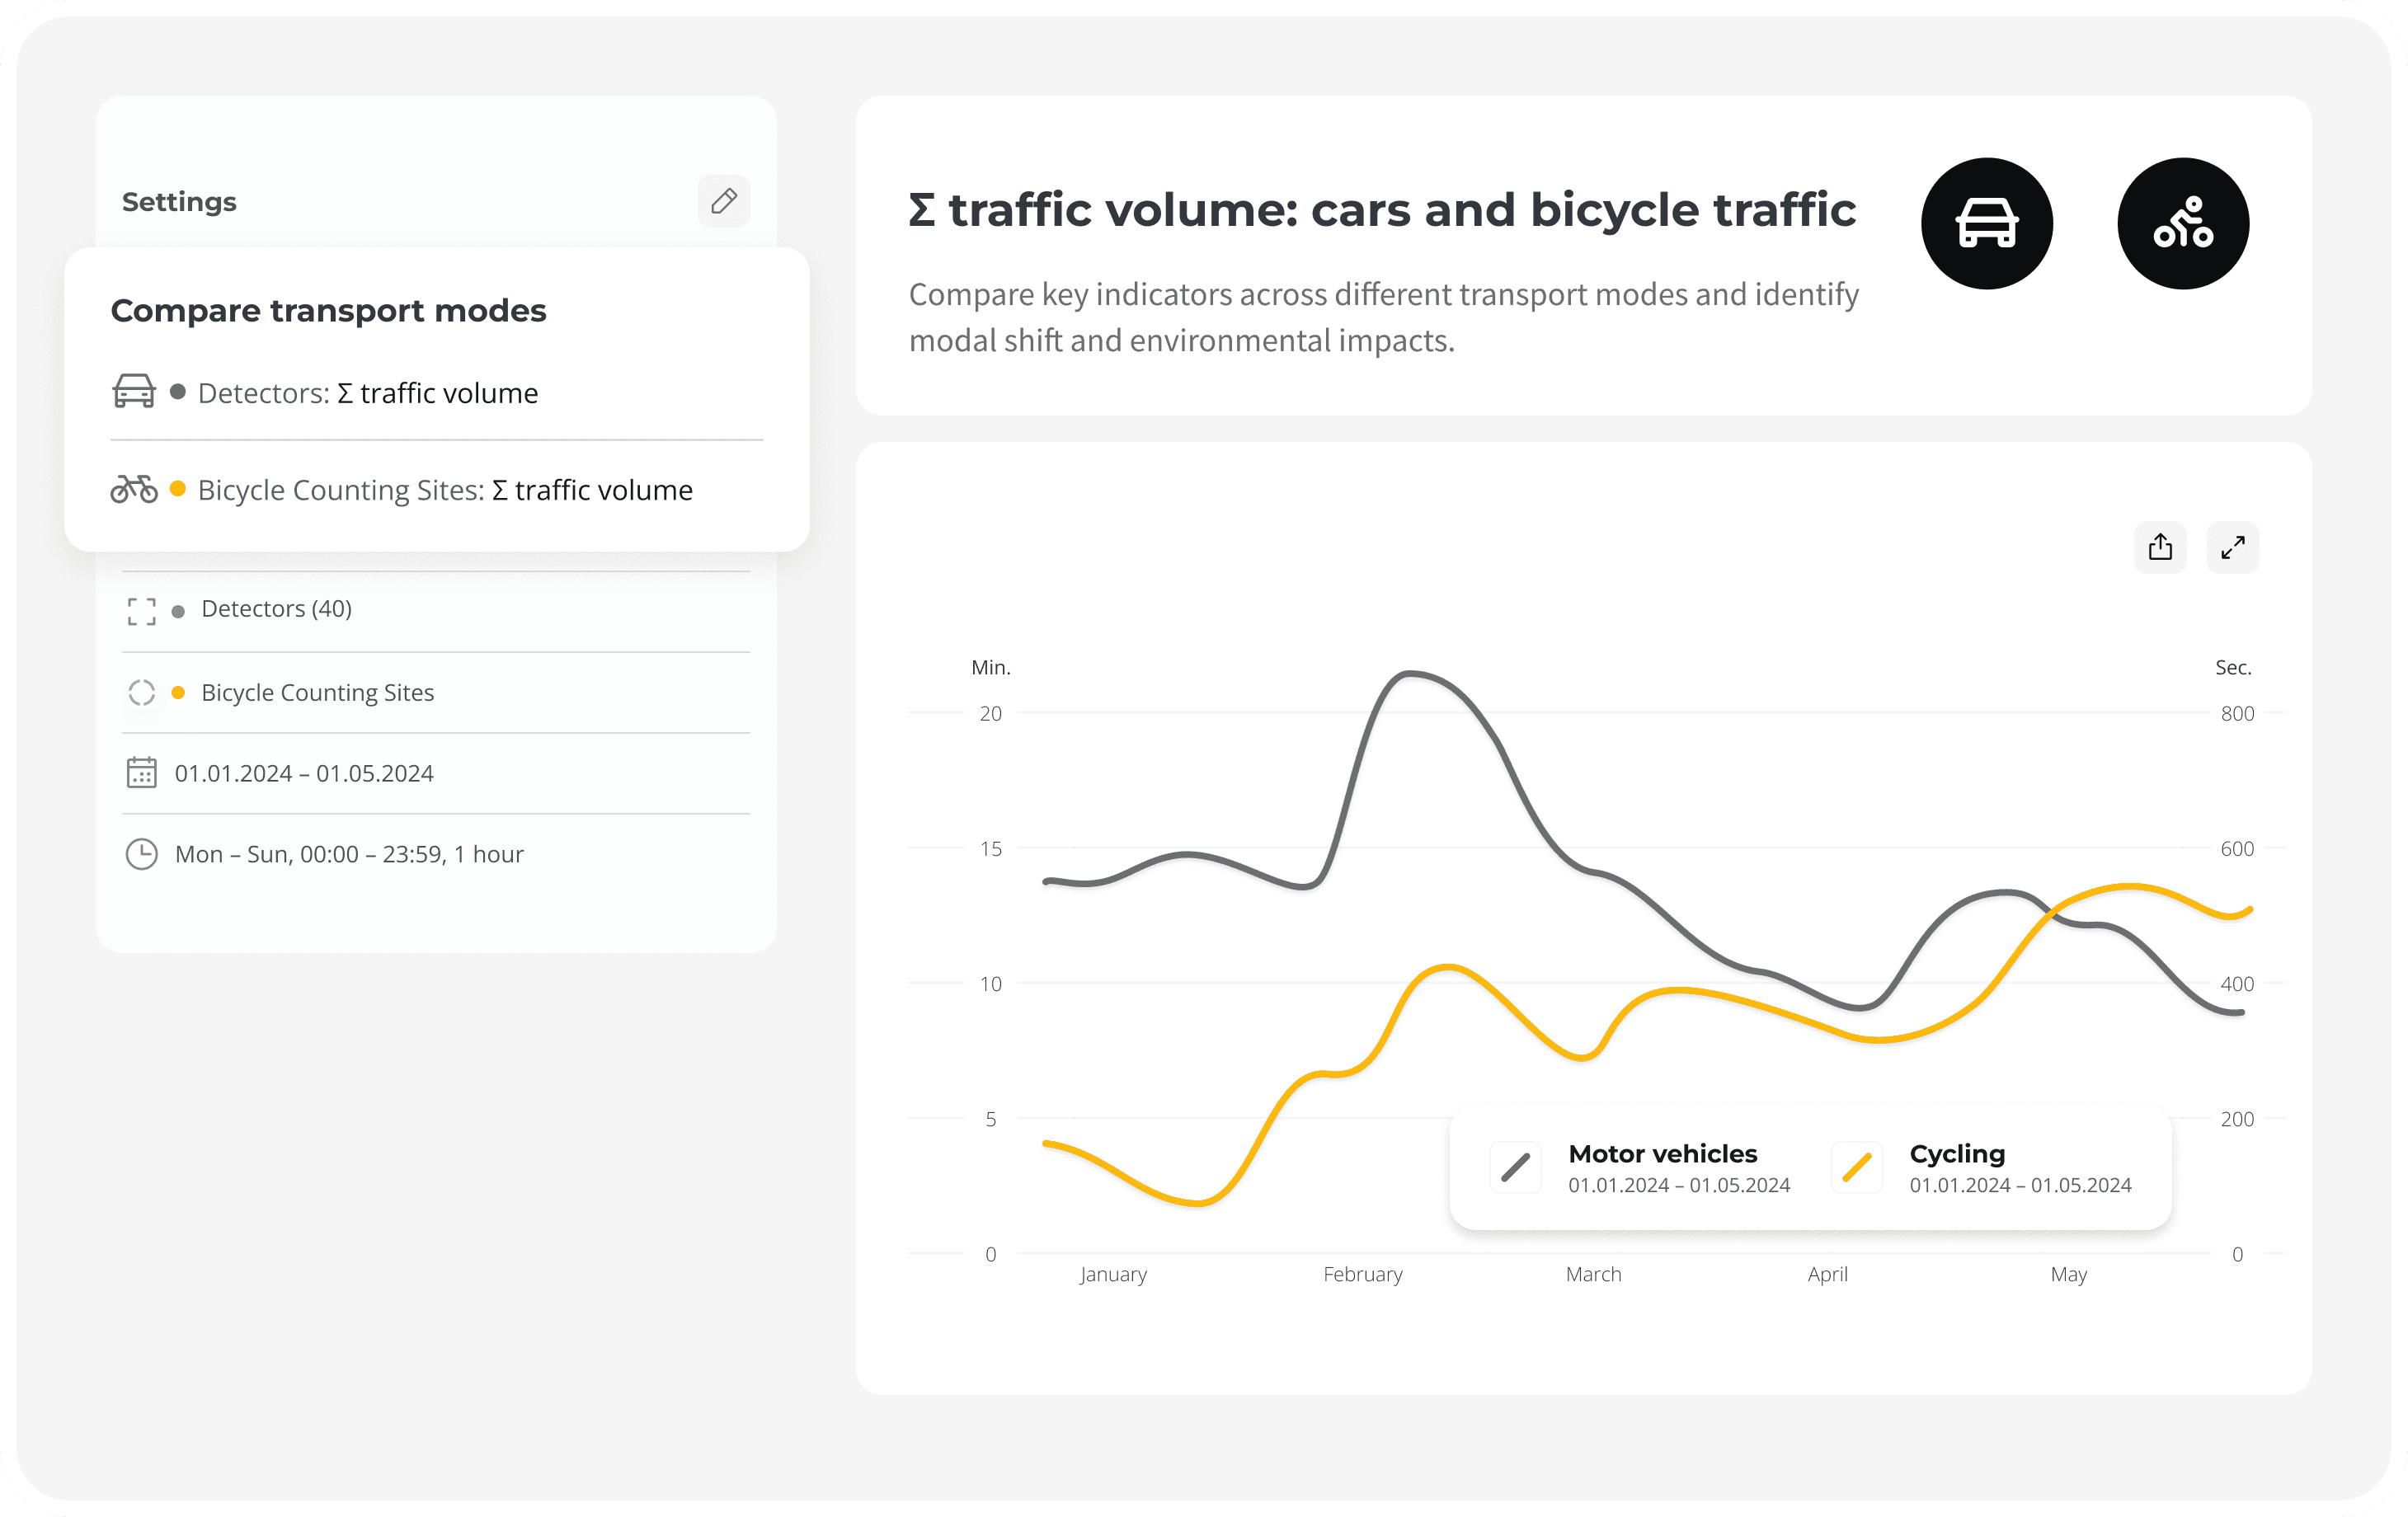
Monitoring
Monitor Measures
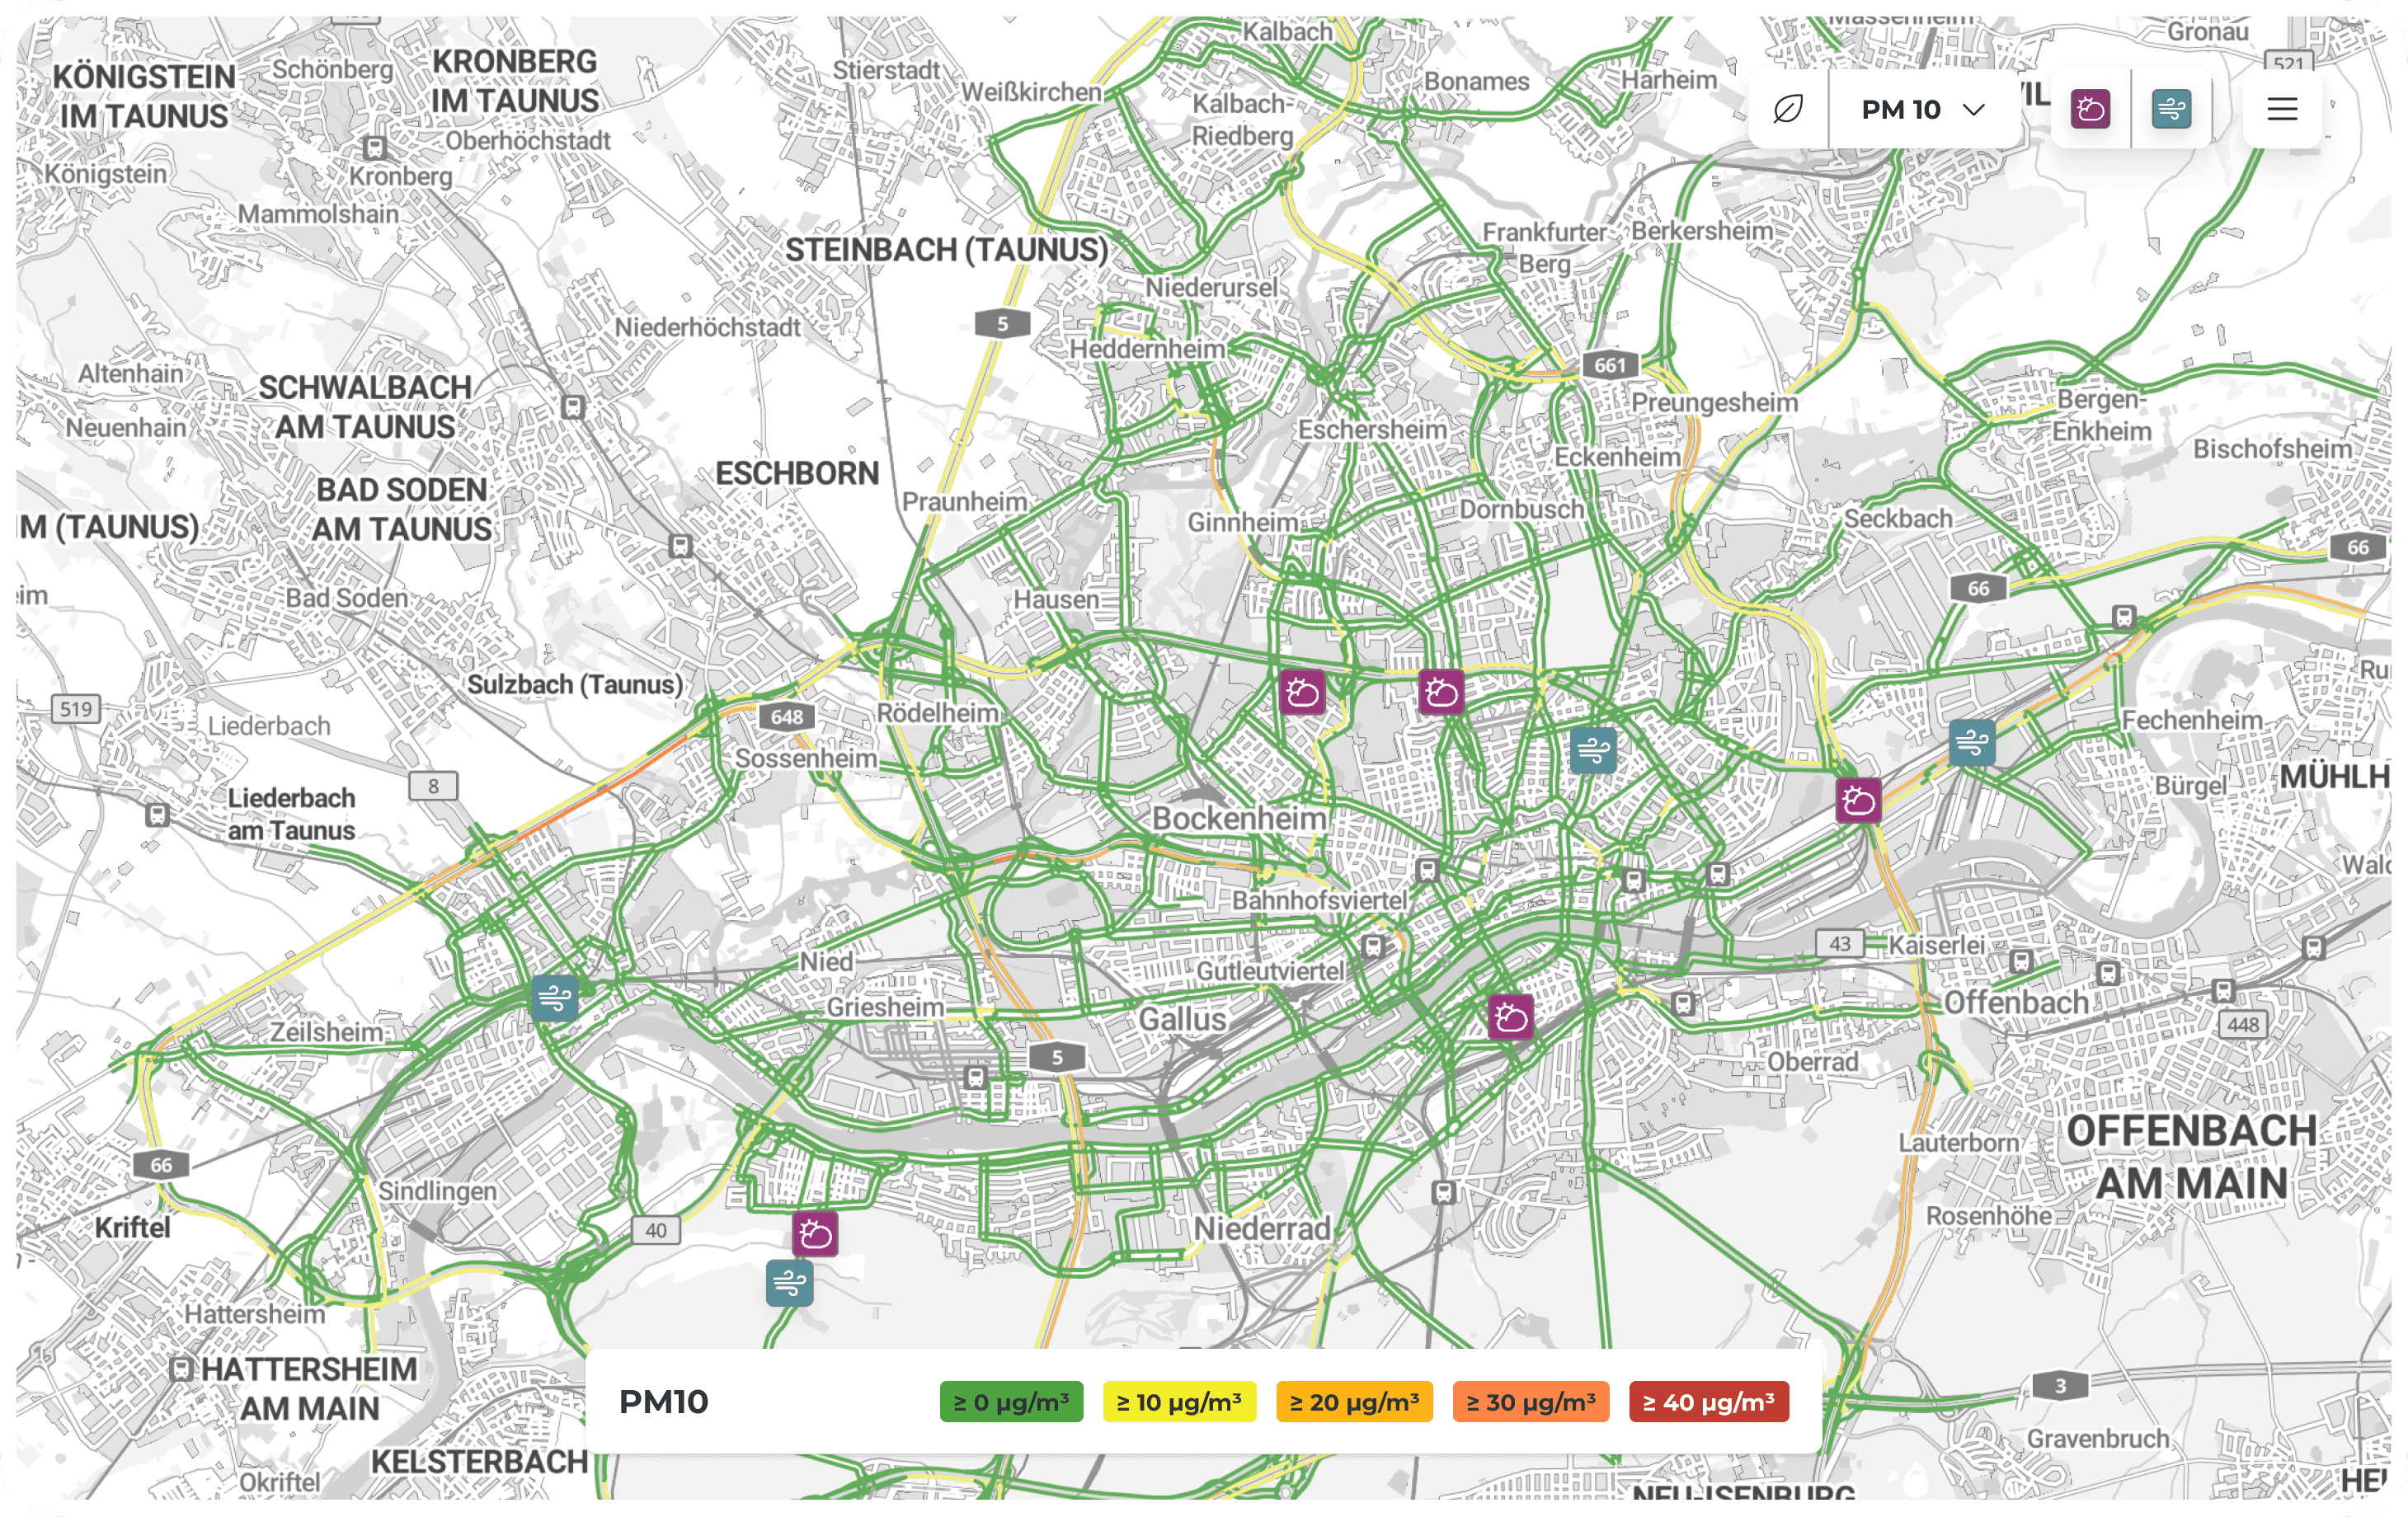
Live monitoring of traffic and environmental data provides reliable situational awareness for traffic management – in real time or for selected time periods. This ensures that developments in the transport system can be tracked across all modes of transport.
02
Monitoring
Monitor Measures
Live monitoring of traffic and environmental data provides reliable situational awareness for traffic management – in real time or for selected time periods. This ensures that developments in the transport system can be tracked across all modes of transport.
03
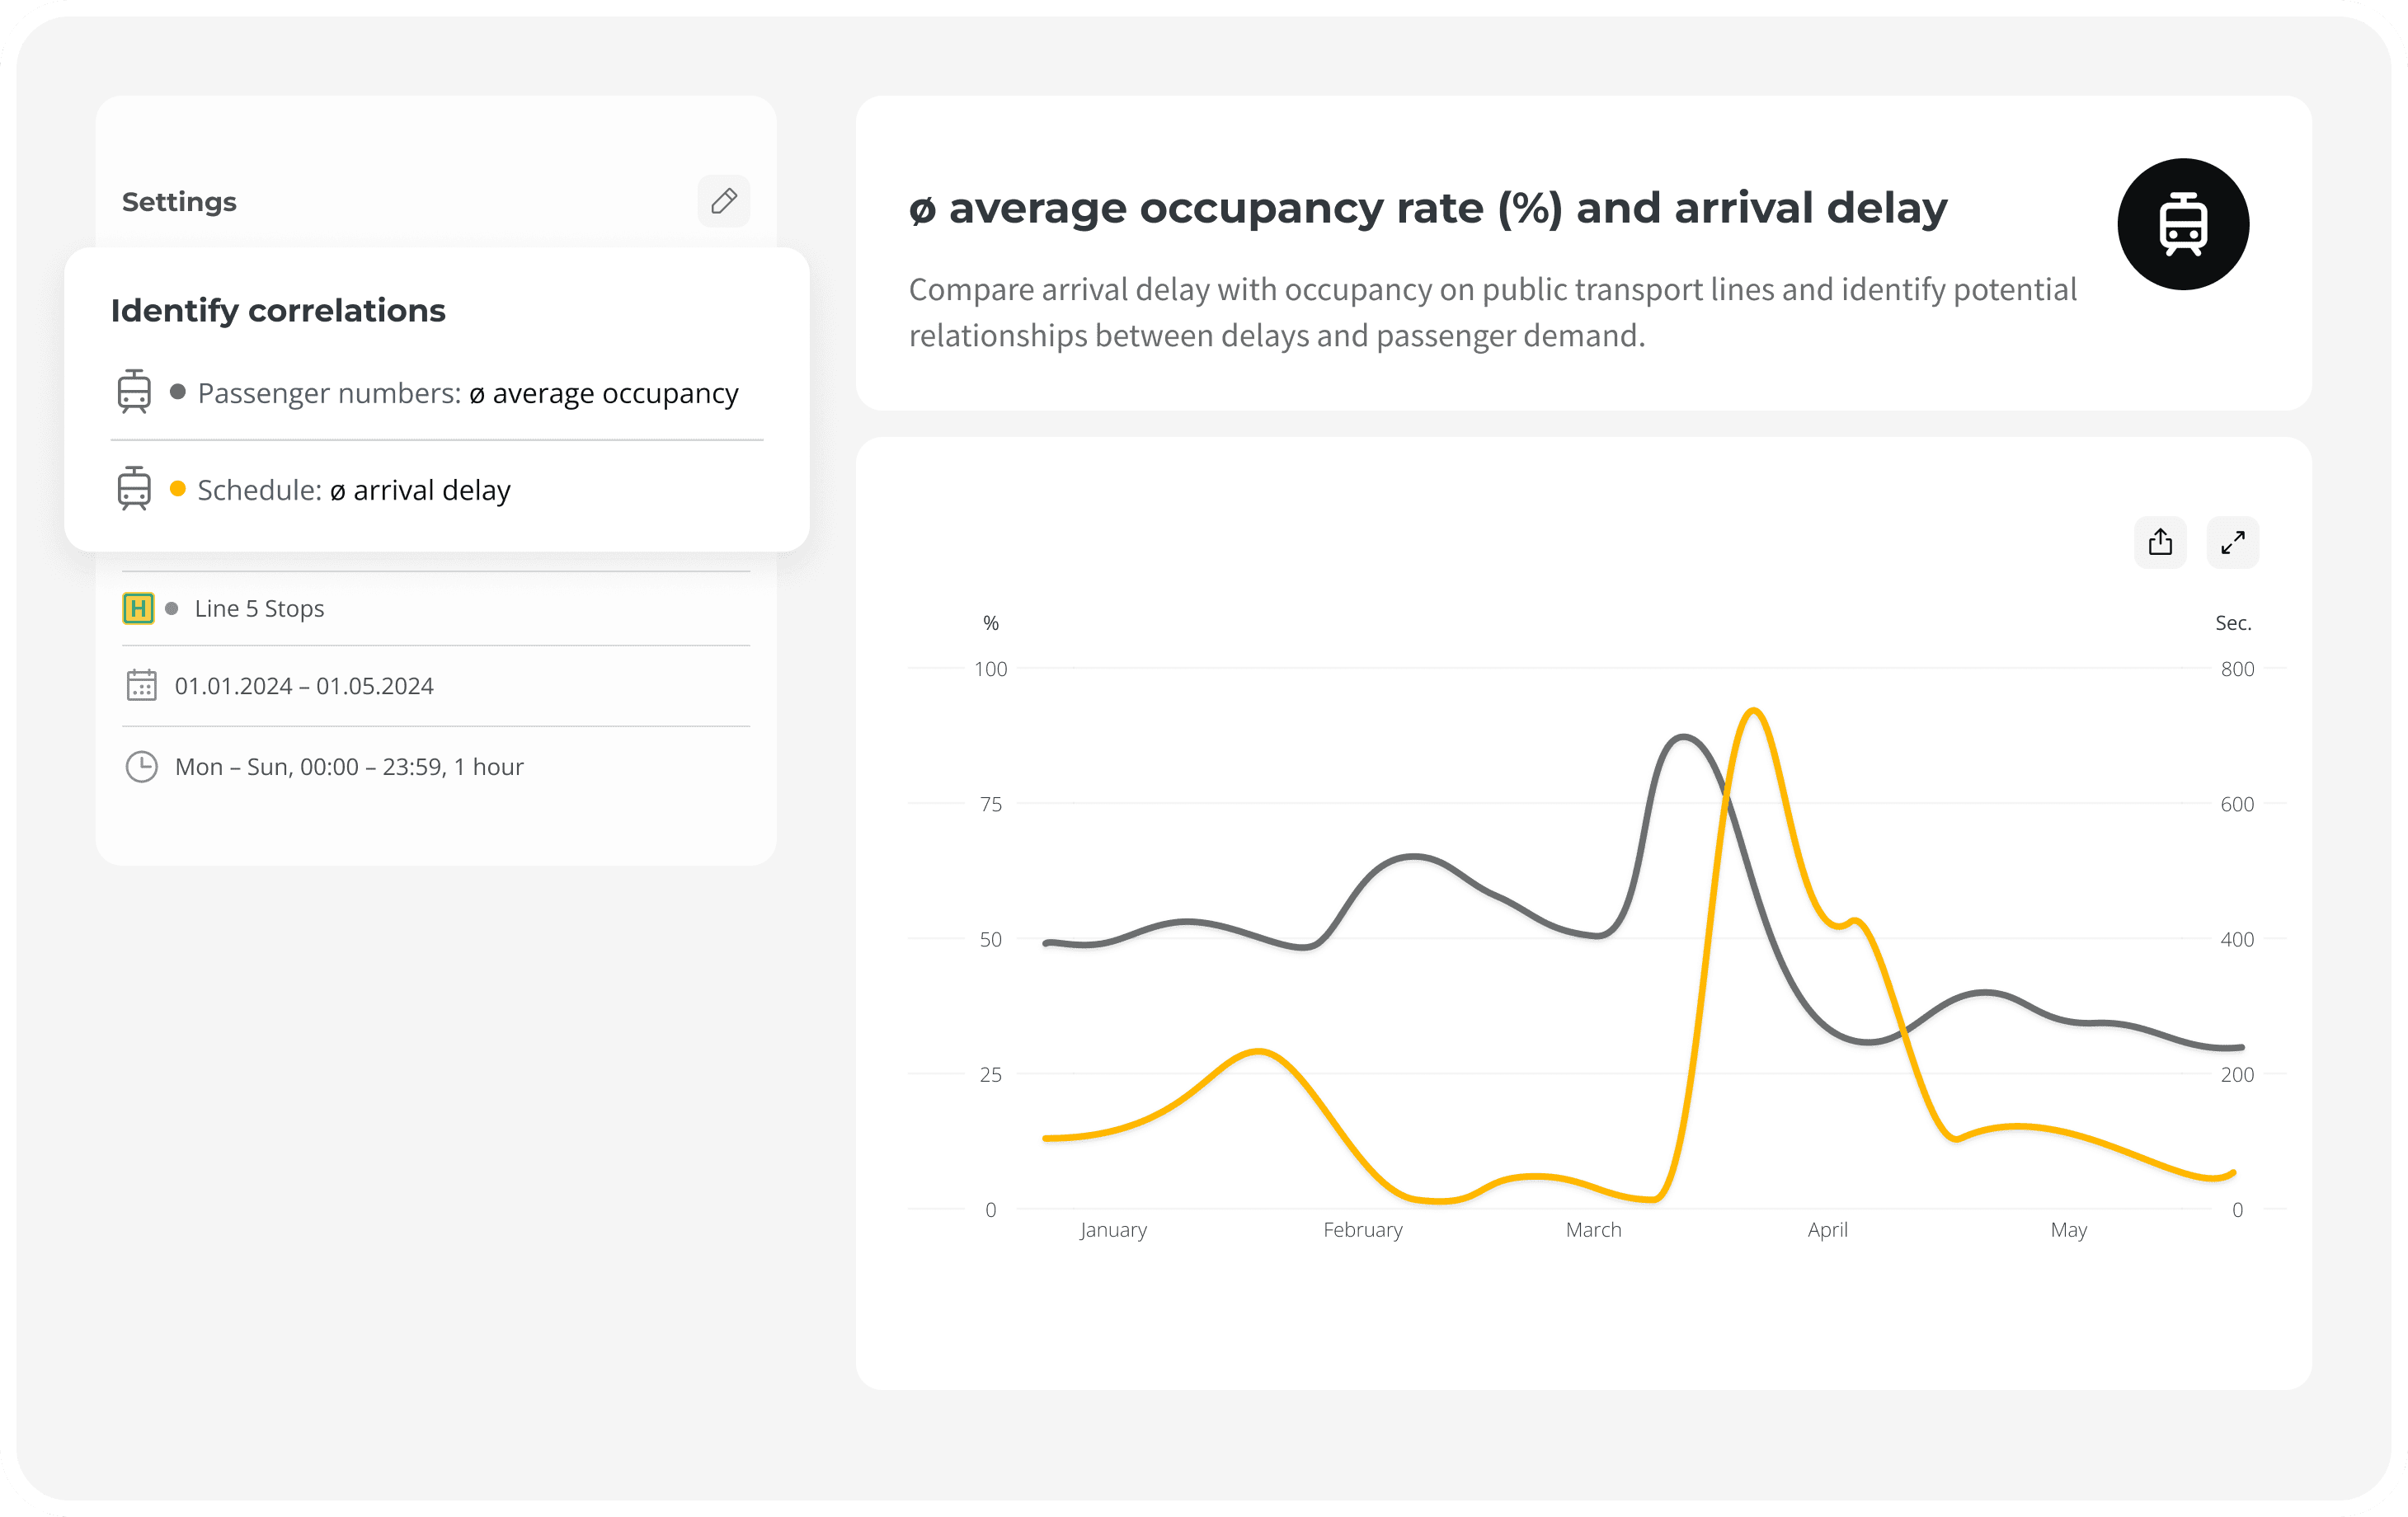
Analysis
Analyze Effects
Identifying critical hotspots enables the development of new strategies, the evaluation of measures, and their targeted refinement.

03
Analysis
Analyze Effects
Identifying critical hotspots enables the development of new strategies, the evaluation of measures, and their targeted refinement.

04
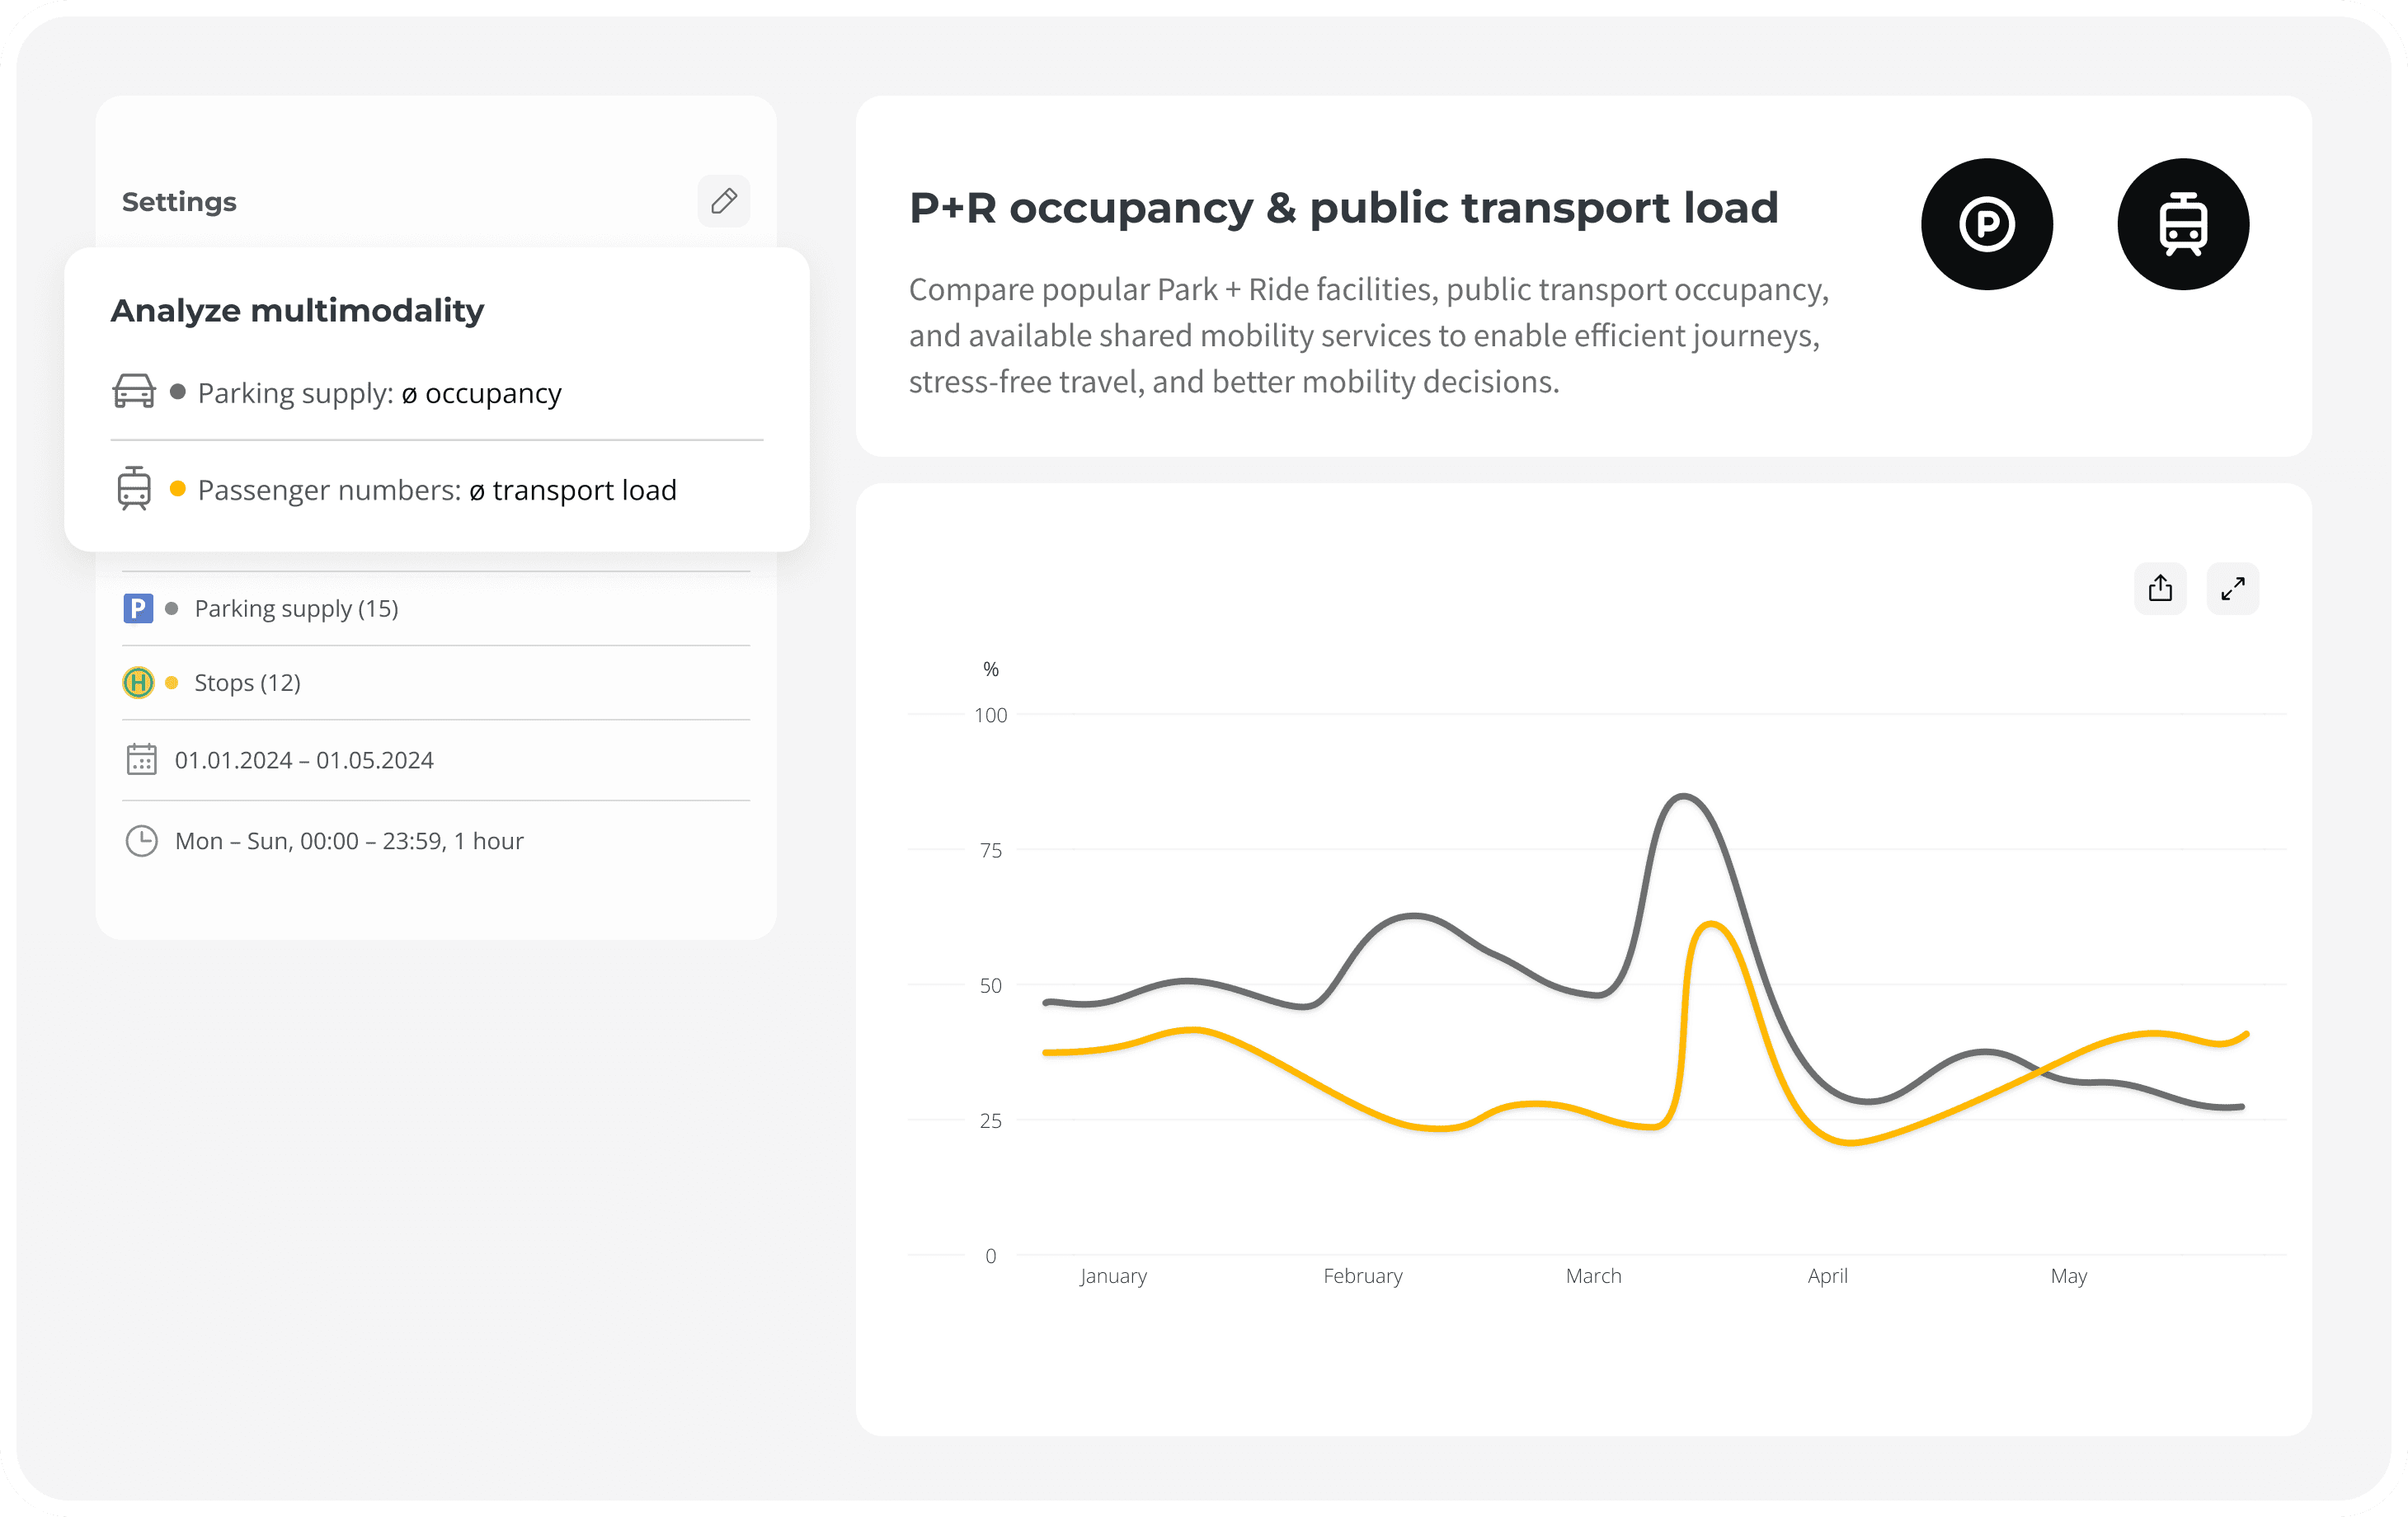
Usage & Rights
Improve Collaboration
Flexible organizational structures and a robust roles and permissions model enable collaboration across administrative stakeholders and regional actors – while ensuring clearly regulated access to data and analyses.
04
Usage & Rights
Improve Collaboration
Flexible organizational structures and a robust roles and permissions model enable collaboration across administrative stakeholders and regional actors – while ensuring clearly regulated access to data and analyses.
Consulting & Procurement
Well Advised.
Proven impact – implemented in a funding-eligible way.
Data-driven analysis and continuous monitoring provide a solid foundation for reporting obligations, impact assessments, and evaluations, while ensuring that measures can be integrated into municipal budgets as well as climate protection, digitalization, and mobility funding programs.
Our experienced team will be happy to assist you with procurement.

For Sharing Providers
For Cities
For Regions
For Consultants
For Transport Operators
For Engineering Firms
For Sharing Providers
For Cities
For Regions
For Consultants
For Transport Operators
For Engineering Firms
Contact
See & Understand
Book a no-obligation consultation and get to know the application and typical use cases in practice. Our team looks forward to hearing from you.


Contact
See & Understand
Book a no-obligation consultation and get to know the application and typical use cases in practice. Our team looks forward to hearing from you.


